

Skip to content

Sun by day.Storage by night.

Gridora forecasts every sunrise across your portfolio and stores the surplus instead of selling it at the day's cheapest hour.

Trusted by operators balancing 14 GW of wind, solar and storage

  • Northvale Energy
  • Solenne Power
  • Kestrel Grid
  • Brightmoor
  • Aurelia Storage
  • Fjordline

Why Gridora

Renewables rarely run short of power. They run short of timing. Gridora reads the weather, the grid and the market as one system, so every megawatt you make lands in the hour it pays the most.

The platform

One calm workspace for the whole energy day.

Forecasts, storage, prices and recommended actions sit side by side, so the people balancing your grid act on the same picture. Try it: switch the range, hover the chart, schedule an action.

Load forecast & balancing

AI forecasts for 42 sites, refreshed every five minutes

Forecasted peak load

2,914MW

+4.2% vs last Friday

Curtailment risk

12%

3 pts lower than yesterday

Available storage

680MWh

74% of 920 MWh capacity

Average spot price

€84.20/MWh

€6.10 higher than yesterday

Load forecast vs. actual

Hourly load in MW, actuals up to 14:00

  • Actual
  • Forecast
  • Expected range
  • Forecast peak

Use the left and right arrow keys to move through the chart.

Load forecast versus actual, hourly load in mw, actuals up to 14:00
TimeForecast (MW)Actual (MW)Expected low (MW)Expected high (MW)
00:001,8601,8421,8231,897
01:001,7601,7711,7251,795
02:001,6901,7021,6561,724
03:001,6501,6381,6171,683
04:001,6701,6611,6371,703
05:001,7801,7951,7441,816
06:002,0102,0341,9702,050
07:002,2602,2412,2152,305
08:002,4102,4362,3622,458
09:002,4402,4612,3912,489
10:002,3802,3522,3322,428
11:002,2902,2682,2442,336
12:002,2202,2312,1762,264
13:002,1902,1762,1462,234
14:002,2602,2432,2152,305
15:002,410Not yet available2,3522,468
16:002,600Not yet available2,5272,673
17:002,810Not yet available2,7202,900
18:002,914Not yet available2,8093,019
19:002,860Not yet available2,7462,974
20:002,690Not yet available2,5722,808
21:002,470Not yet available2,3512,589
22:002,240Not yet available2,1242,356
23:002,020Not yet available1,9072,133

Generation mix

Share of output

  • Wind41%
  • Solar33%
  • Hydro14%
  • Other12%

Recommended actions

0 of 3 scheduled

  • Charge Ridgeway battery

    13:00 to 15:00, absorbs 186 MWh of solar surplus

  • Bid 60 MW into the evening peak

    18:00 to 20:00 at an expected €118/MWh

  • Pre-cool the Harbor district

    16:30 to 17:30, trims 42 MW off the peak

  • Refreshed every five minutes

    Weather models, SCADA readings and market prices stream in continuously, so the plan moves when the sky does.

  • One picture for every team

    Control room, trading desk and asset managers work from the same numbers instead of three spreadsheets.

  • Every number explained

    Trace any forecast back to the weather, asset data and assumptions behind it before you act on it.

Solutions

Forecast. Balance. Trade.Three jobs, one platform.

Gridora replaces the patchwork of weather feeds, spreadsheets and late phone calls with one system that plans the energy day for you. Each stage hands its answer to the next.

Forecast01 / 03

See demand and generation coming, a week ahead.

Weather-aware forecasts at 15-minute resolution for every asset you run. Gridora learns each site, from icing turbines to hazy afternoons, and shows you how sure it is.

Next, Balance. The surplus it predicts becomes the battery plan.

Balance02 / 03

Charge on the surplus. Discharge into the peak.

Dispatch plans that respect cycle limits, warranty terms and grid constraints, ready for one-click approval or autopilot.

Next, Trade. Stored energy is offered into the hours that pay.

Charging now
+42 MW
Full by
15:10
Held for the peak
520 MWh

Ridgeway battery, today

  • Charge
  • Discharge
  • Idle
Trade03 / 03

Sell every megawatt in the hours that pay.

Gridora ranks every window by price, risk and grid limits, then drafts the bid. Today that is an expected €41,200 more than flat selling.

Back to Forecast. Every settled bid sharpens tomorrow's forecast.

Day-ahead price, €/MWh

  • Bid window
  • Other hours

Prices range from €41 to €131 per MWh, peaking at 19:00. Recommended bid windows are 07:00 to 10:00 and 17:00 to 21:00. Use the arrow keys to read each hour.

Running underneath

  • Curtailment alerts

    Know hours ahead when output will outrun the grid, with a plan for where the surplus should go.

  • Asset health

    Spot the turbine, string or battery cell that is underperforming before it costs you a peak.

  • Audit-ready reports

    Every dispatch decision is logged with the forecast and price that justified it.

Insights

Operators see the difference in the first season.

Results from each customer's first twelve months on Gridora, measured against their own baseline from the year before.

less energy curtailed
38%
Surplus is stored or sold instead of switched off.
day-ahead forecast accuracy
96.4%
Averaged across wind, solar and load after calibration.
faster dispatch decisions
2.3x
From forecast to approved plan, measured per shift.
added market revenue
€6.8M
Across customer portfolios in their first year.

We used to learn about curtailment the morning after. Now the evening plan is ready before lunch and the batteries are already charging when the sun overdelivers.

Maren HoltHead of Operations, Northvale Energy

The forecasts held up through our first winter of icing alerts. That was the week our trading desk stopped keeping its own spreadsheet.

Tomas ReyesTrading Lead, Kestrel Grid

Our control room and our traders finally look at the same picture of the day. Fewer phone calls, and faster ones.

Ines KovacGrid Integration Manager, Solenne Power

How it works

Live in three weeks, not three quarters.

Gridora works with the systems you already run. Our grid engineers handle the setup alongside your team.

  1. 01

    Week 1

    Connect your sites

    Plug in SCADA, meters, battery systems and market feeds over the protocols you already use. No new hardware on site.

  2. 02

    Week 2

    Calibrate the forecasts

    Gridora learns from two years of your history and local weather, tuning a forecast for every asset's quirks.

  3. 03

    Week 3

    Act with confidence

    Approve dispatch plans in one click, or let autopilot run inside the limits you set for charge, cycles and risk.

  4. Live by day 21. Your first plan is approved, and the forecasts keep learning.

Connects to what you already run

Standard industrial protocols, market data and weather feeds, read only by default.

  • Modbus TCP
  • DNP3
  • IEC 61850
  • OPC UA
  • MQTT
  • Day-ahead and intraday market feeds
  • Numerical weather models
  • CSV and SFTP drops
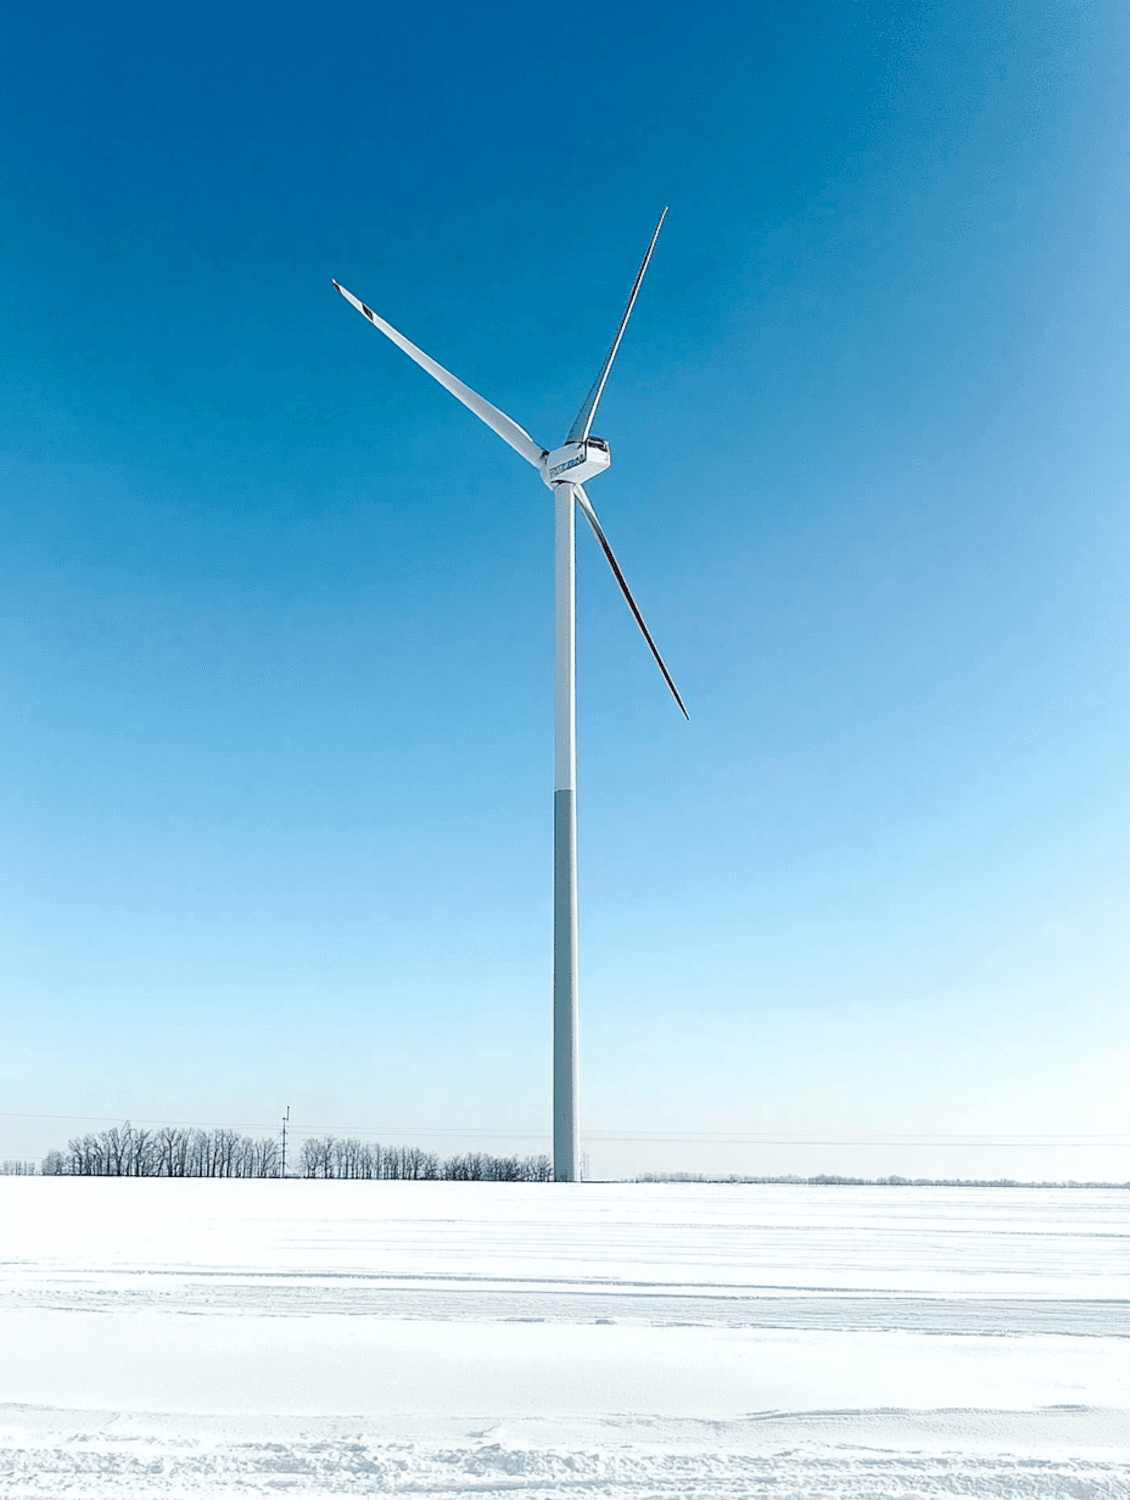
A wind turbine standing in a snowy landscape under a clear blue sky

Our mission

Make renewable power as dependable as the grid needs it to be.

About Gridora

Built by grid engineers who got tired of guessing.

Gridora started in a control room, where forecasts lived in spreadsheets and the evening peak always arrived early. Today our team pairs power systems engineering with machine learning, so operators can plan the day instead of chasing it.

under forecast
14 GW
sites connected
320+
platform uptime
99.95%
  • EU-hosted and encrypted

    Encrypted in transit and at rest, with role-based access for every team.

  • Your data stays yours

    Export everything at any time. We never sell or pool customer data.

  • Engineers on call

    A grid specialist is reachable around the clock during your first season.

FAQ

Questions operators ask us first.

Anything else you want to know, ask us on a demo call. We are happy to go deep on your assets, data and market.

Talk to a grid specialist
Which assets does Gridora support?

Wind, solar, battery storage, hydro and flexible loads. Hybrid sites are modelled as one portfolio, with every asset forecast on its own so you can see exactly where a surplus will come from.

How accurate are the forecasts?

After calibration, day-ahead accuracy typically lands between 94% and 97% depending on the asset mix and climate. Live accuracy is shown per site, so you never have to take our word for it.

Do we need new hardware on site?

No. Gridora reads from the systems you already run, including SCADA, meters, battery management systems and market feeds, over standard protocols or secure file drops.

Can Gridora dispatch batteries automatically?

Yes, when you want it to. Most teams start in advisory mode, approving each plan, then switch on autopilot within limits they set for state of charge, cycling and market exposure.

Where is our data stored?

In EU data centres, encrypted in transit and at rest, with role-based access for every team. Your data stays yours and can be exported at any time.

How is Gridora priced?

A platform fee plus a rate per megawatt under management, so cost scales with your portfolio. Pilots start with a single site for 60 days, and the demo call is the quickest way to get a quote.

Book a demo

See your own portfolio forecast in 30 minutes.

Share a few details and a grid specialist will walk you through Gridora using data from a site like yours.

  • A live forecast for a site like yours
  • Storage and trading scenarios for next week
  • A rollout plan with timing and pricing

No commitment. Most demos are booked within two working days.

Request your demo

Fields marked with an asterisk are required.

What would you like to improve? (optional)

We only use your details to arrange your demo. Read our privacy policy.

Steady power for every peak

Gridora helps operators curtail less, earn more from every megawatt and keep a cleaner grid running on time.

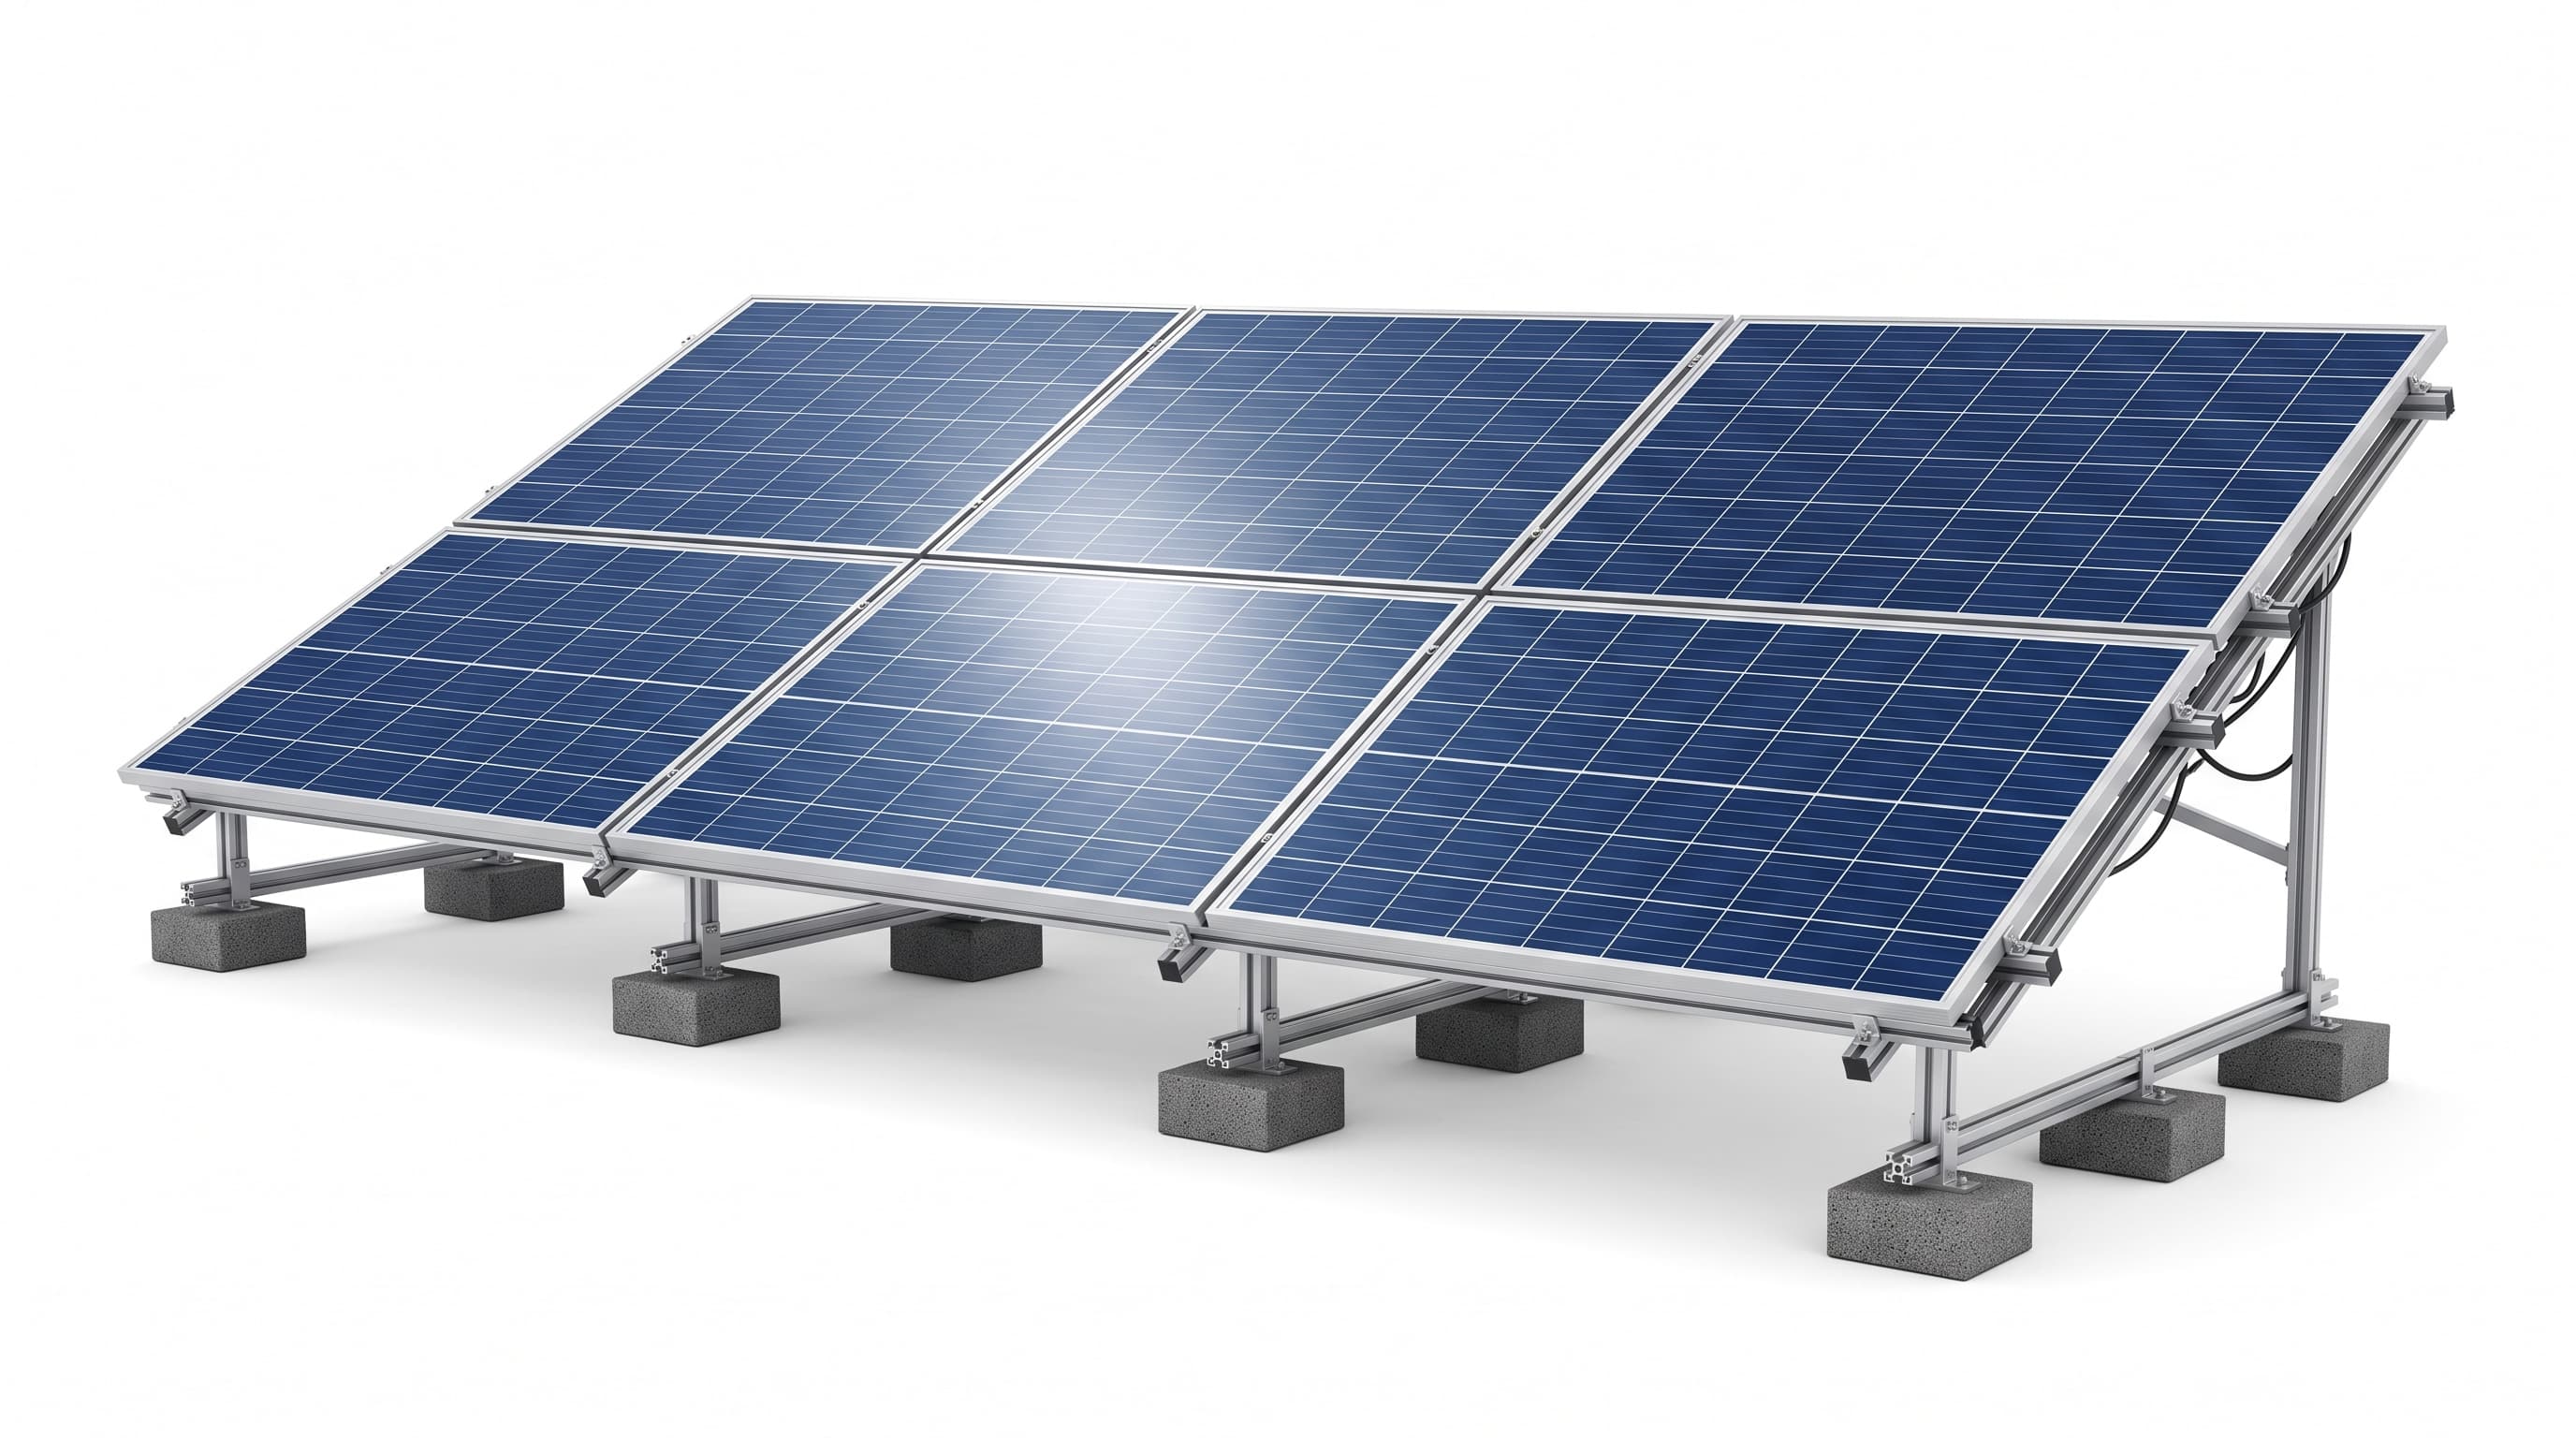
Six panels angled at 24 degrees to catch the midday sun.